Case Study: How Analytics Helped an Underdog Team Succeed
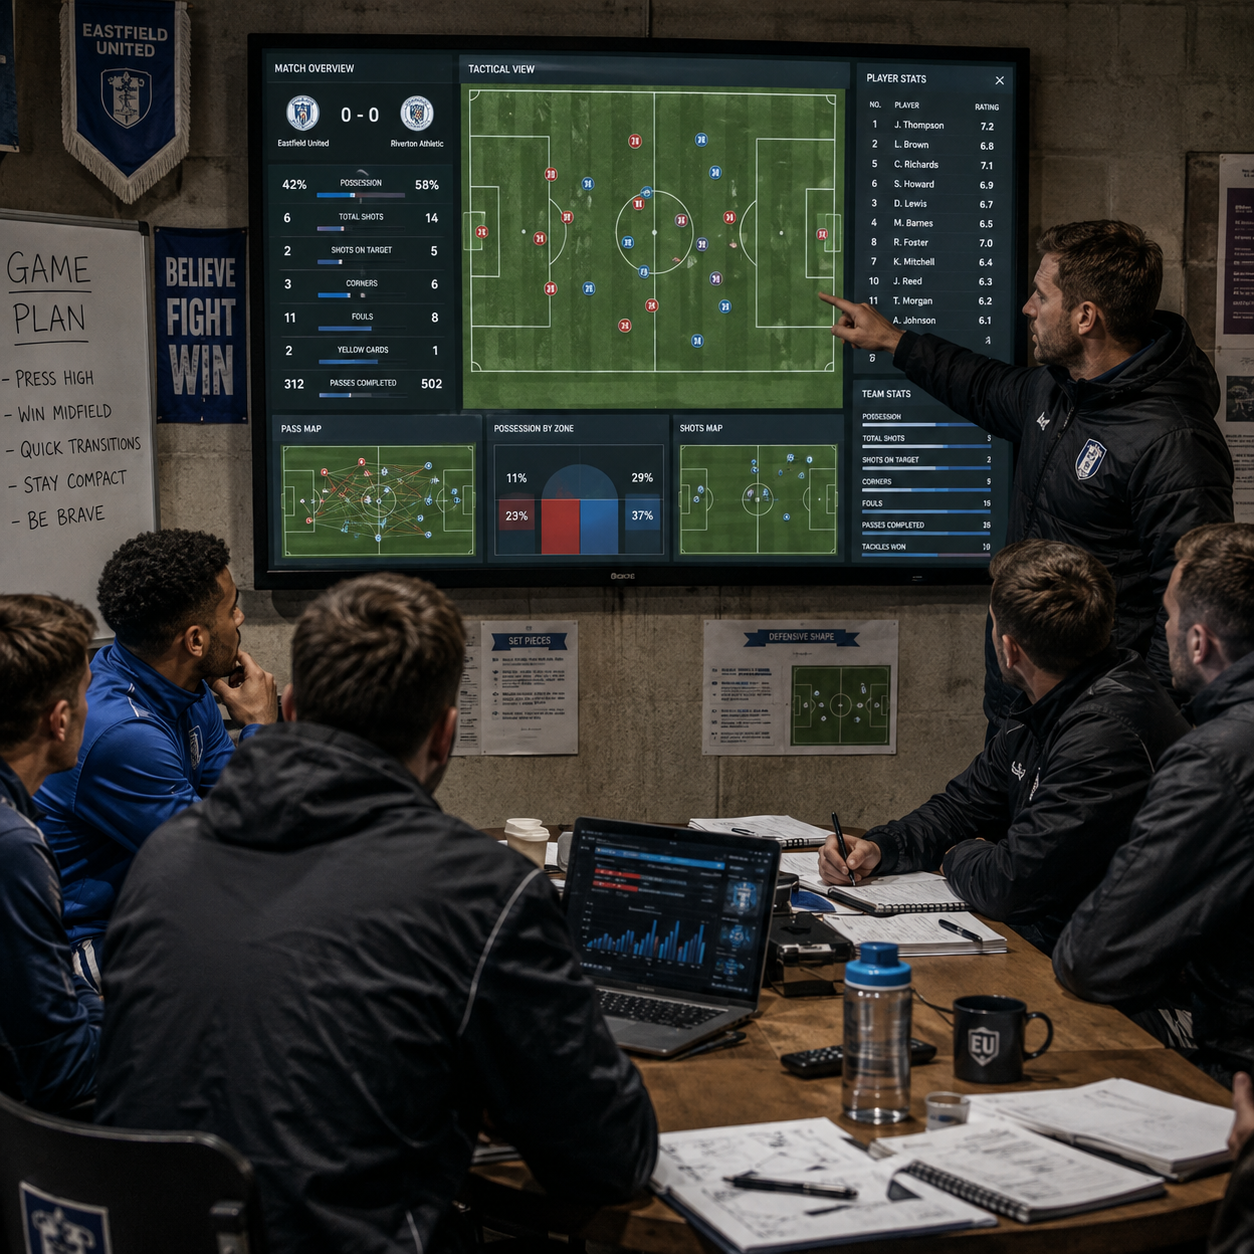
Football analytics can help an underdog team compete with richer clubs when it focuses attention on repeatable advantages. The value does not come from collecting endless numbers; it comes from connecting performance data with good coaching, suitable players, and clear tactical decisions.
This case study follows a realistic composite example rather than a named club or historical season. The team had a limited transfer budget, a small coaching staff, and fewer resources than its league rivals. Analytics did not create success on its own. Instead, it helped the club decide where to spend, which problems to solve first, and how to turn narrow advantages into points.
The Underdog’s Challenge and Competitive Context
An underdog team usually needs to improve several areas at once while lacking the budget to buy proven solutions. In this case, the club faced inconsistent chance creation, too many dangerous defensive transitions, and a recruitment process based heavily on reputation and personal contacts.
The team’s league position made the problem visible, but the table did not explain it. Results fluctuated from week to week, while match review revealed more stable weaknesses:
- Possession often ended with low-quality shots from outside the penalty area.
- Turnovers in wide attacking areas exposed the full-backs and central defenders.
- The press looked energetic but rarely forced opponents into genuinely poor decisions.
- New signings had respectable individual records but did not always fit the team’s style.
Conventional analysis tended to ask whether the team won or lost. A more useful question was: which actions consistently moved the team toward better chances and fewer dangerous concessions? That shift gave the coaching staff a practical starting point. The objective was not to copy a wealthy club’s data department, but to identify two or three controllable advantages.
Building a Practical Football Analytics Strategy
A practical football analytics strategy combines event data, video, staff expertise, and a short list of decision-focused metrics. The team began with information it could explain and act on, rather than building an elaborate model that coaches could not use.
The club created a weekly workflow with four stages:
- Collect: record passes, shots, locations, set pieces, turnovers, recoveries, and defensive actions from available match data.
- Filter: separate meaningful patterns from isolated incidents and account for opponent quality and game state.
- Translate: connect numbers to video clips that showed what actually happened on the pitch.
- Apply: choose a small number of training or match objectives for the players.
Expected goals, or xG, became one reference point. xG estimates the probability that a shot becomes a goal based on factors such as location, angle, assist type, and defensive pressure. It helped the club distinguish between a team that created several dangerous chances and one that simply accumulated shots. However, the staff treated xG as a diagnostic tool, not a complete rating of team quality.
Other measures included shot quality, expected assists, box entries, possession losses under pressure, pressing efficiency, recoveries within five seconds of a turnover, and the frequency of defensive transitions that led to opponent shots. Analysts also reviewed set-piece outcomes because dead-ball situations offered a relatively inexpensive route to improvement.
Data alone could not show whether a player made the correct run, whether a press failed because of poor timing, or whether a defender had been left in an impossible two-versus-one situation. Video and coaching judgment supplied that context. The result was a shared language rather than a spreadsheet imposed on the dressing room.
Using Data to Improve Recruitment and Squad Planning
Football analytics improved player recruitment by identifying role fit and repeatable behaviours instead of relying mainly on goals, assists, or reputation. The club used data to narrow the market, then used scouting and interviews to test whether candidates could perform in its specific environment.
For each position, the recruitment group built a role profile. A prospective wide player, for example, was assessed on:
- Progressive carries and passes into the final third.
- Entries into the penalty area rather than crosses alone.
- Ball retention after receiving under pressure.
- Defensive recovery runs and pressing actions after losing possession.
- Age, injury history, salary expectations, and potential resale value.
This approach uncovered players whose headline statistics looked ordinary because they played for weaker teams. A forward with fewer goals might still produce strong shot locations, create separation for teammates, and press effectively. A central midfielder might have modest assist numbers while consistently receiving between lines and moving the ball forward.
The club also added a context filter. Analysts compared performance with team possession, league strength, minutes played, position, and tactical role. They watched at least several full matches before recommending a player. Recruitment decisions therefore followed a three-part test: production, fit, and affordability.
That process reduced one common risk in underdog recruitment: buying a statistically impressive player whose previous system concealed weaknesses. Choosing lower-cost talent created financial flexibility, but it also meant accepting development time and greater uncertainty. The coaching staff had to plan individual support rather than expect every signing to deliver immediately.

Turning Analytics Into Tactical Advantages
Analytics created tactical advantages when the team converted patterns into specific behaviours for pressing, chance creation, defensive structure, and opposition scouting. The aim was to make decisions clearer before and during matches.
Improving chance creation
Match analysis showed that the team’s shot count overstated its attacking threat. Many attempts came after slow possessions that ended with crowded, low-probability efforts. Coaches responded by prioritising earlier entries into the penalty area, cutbacks from the byline, and third-player runs around the striker.
Training exercises rewarded the sequence that produced the chance, not just the final shot. Players learned to recognise when a switch of play had moved the opposition block far enough to attack the far-side channel. The team did not abandon crosses or long-range shooting; it became more selective about when those actions made sense.
Making the press more efficient
Pressing efficiency was measured through triggers and outcomes. Analysts tracked whether pressure followed a backward pass, poor first touch, or predictable pass toward the sideline, and whether it produced a recovery, forced clearance, or dangerous turnover.
The coaching staff simplified the plan. Instead of asking every player to press constantly, the nearest player curved the run to block one passing lane while teammates moved into positions that reduced the opponent’s options. This lowered wasted sprints and made the press more coordinated.
Preparing for opponents
Opposition scouting combined video with repeatable tendencies. The team identified how each opponent progressed the ball, where its full-backs stood during attacks, and what happened immediately after losing possession. Against a side that overloaded one flank, the underdog prepared a compact defensive shift and a fast switch into the space left on the opposite side.
These plans remained flexible. A pattern observed across five matches could disappear when the opponent changed its midfield structure. Analysts presented probabilities and examples, while coaches selected the final response. That distinction prevented tactical analysis from becoming a rigid script.
Measuring Progress on and Off the Pitch
The team measured progress through process metrics as well as results. A sustainable improvement showed up first in chance quality, territory, decision-making, and defensive control before it necessarily appeared in league position.
The performance dashboard tracked:
- Expected goals for and against, separated by open play and set pieces.
- Average shot quality and the share of attempts from central penalty-area zones.
- Box entries, final-third recoveries, and successful attacking transitions.
- Pressing efficiency, forced turnovers, and defensive actions after losing the ball.
- Goals conceded after turnovers and the quality of chances allowed during transitions.
- Player availability, training load, and minutes managed across congested periods.
Results still mattered, but the staff avoided declaring the project successful after a short winning run. Football contains substantial variance: a deflection, goalkeeper performance, finishing streak, or red card can distort several matches. A better test was whether the team sustained improved process numbers across a meaningful sample and against different types of opponents.
Off the pitch, the club reviewed recruitment hit rate, wage efficiency, injury availability, and how quickly new players understood their roles. Analytics also saved time. A concise video package linked to three match objectives was more useful than a forty-page report that nobody revisited.
The Human Factor: From Insights to Execution
The human factor determined whether analytics became useful behaviour or ignored information. Analysts supplied evidence, coaches provided tactical meaning, and players tested the ideas under match pressure.
The club used a simple communication rule: every analytical finding had to answer three questions.
- What is happening repeatedly?
- Why might it be happening?
- What should a player do differently?
For example, saying that the team conceded too many transition shots was insufficient. The actionable version identified the turnover zone, the missing cover position, and the recovery decision required from the nearest midfielder. Players could then see the relevant clips, rehearse the movement, and review whether it worked.
Trust developed when the coaching staff allowed players to challenge the interpretation. A number might indicate that a winger lost possession frequently, while video showed that the winger received difficult passes with no supporting option. Blaming the player would miss the structural problem.
Analytics also had to respect fatigue, confidence, opponent quality, and game context. A player who made fewer pressing actions after a long travel week was not automatically underperforming. Expert football judgment remained essential because data describes events; it does not fully explain intention or responsibility.
Lessons Other Underdog Clubs Can Apply
Other underdog clubs can begin with a small, staged analytics system built around their most expensive problems. The first priority should be clarity, not sophistication.
A realistic three-stage framework
- Stage one: establish a baseline. Track shots, xG, box entries, turnovers, set pieces, and goals conceded after transitions for six to eight matches. Pair every important number with video.
- Stage two: choose one attacking and one defensive project. Examples include improving central chance creation and reducing shots conceded within ten seconds of losing possession.
- Stage three: connect analysis to recruitment and review. Build role profiles, assess player fit, and revisit the chosen indicators monthly rather than changing priorities after every result.
A small club can start with a spreadsheet, publicly available match information, video tagging, and one staff member who coordinates the process. Paid tracking data may add detail, but it cannot compensate for unclear questions or poor implementation.
Several mistakes deserve attention:
- Chasing one metric: xG can reveal chance quality, but it cannot measure every defensive, tactical, or psychological factor. Use a balanced set of indicators.
- Ignoring context: Compare roles, opponents, score state, and minutes before judging a player or tactic.
- Changing plans too quickly: Small samples contain noise. Look for repeated patterns before making major recruitment or tactical changes.
- Presenting data without an action: Coaches and players need a decision, drill, or positional rule linked to the finding.
The central lesson is disciplined integration. Football analytics helped this underdog team see where marginal gains were available, but coaching staff, recruitment judgment, player development, and execution converted those insights into performance. Clubs with limited resources can follow the same principle: measure fewer things, connect them to football problems, and judge success through sustainable processes as well as results.
Frequently Asked Questions About Football Analytics for Underdog Teams
Which football analytics metrics are most useful for underdog teams?
The most useful starting metrics include xG for and against, shot quality, box entries, possession losses, pressing efficiency, transition shots conceded, set-piece chances, and player availability. No single metric captures team quality, so clubs should combine outcome measures with process indicators.
How can a small club begin using data without a large analytics department?
A small club can begin with a spreadsheet, consistent video review, and a short weekly dashboard. Assign one person to maintain definitions, focus on two or three football questions, and present findings through clips and clear actions rather than technical reports.
Can analytics improve recruitment as well as tactics?
Yes. Analytics can identify undervalued players by comparing role-specific actions, efficiency, age, availability, league context, and cost. Scouting and coaching judgment must still test personality, adaptability, technical quality, and tactical fit.
How should teams measure whether their analytics strategy is working?
Teams should review process metrics over a meaningful sample, then compare them with results, player availability, recruitment outcomes, and implementation quality. Improvement is more credible when better chance quality, defensive control, and role clarity persist across varied opponents rather than appearing during a brief run of wins.